Kamis, 11 April 2013

Silver, an Exception Forecast - 2013.04.11


Continuing my post about Silver, these are my additional prediction about Silver:
  1. From the daily chart above, I can see that there is a clear Bullish Divergence shows up, that means most likely Silver is making a reversal, or at least a significant correction to the north. I think the journey to the north is not over yet.
  2. Silver has entered the very strong support level area at price 26 which means there should be a bounce happens.
  3. There is big probability, Silver will go up to at least the area of 23.6% Fibo which has also been the sideways area for more than one month (grey ellipse), from 20 Feb to the last week of March. I think Silver will enter and test this area, which now acting as resistance area. This area will be my first taking-profit area.
Of course this is only my own technical prediction, which means it is not a 100% must-be-happened-truly. Since I'm still a human, there is still a chance that I make mistake.
So, as usual, keep good MM and put SL as your safety devices.
Trade well....

GG - 2013.04.11

Selasa, 09 April 2013

Personal Record, The Result of Previous Forecast - Silver and Gold

SILVER - Daily

GOLD - Daily

Just for personal record, when I post this:

* Silver has moved up as predicted to 28.065 from 27.143
* Gold has moved up as predicted to 1590.48 from 1567.89

GG - 2013.04.09

Jumat, 05 April 2013

Special Note about Silver

This is really a special note because I'm not writing about gold here.
Instead, I'm talking about Silver, because I can't stand not to mention it in my blog with all this perfect technical conditions.


I've been waiting for some days for this moment. I really think that this is the time to go long with silver.
Just look at those all technicals in the Daily chart above.

1. RSI and William Percent Range are in the extreme oversold area and begin to move up.
2. The price has touched it's trend support (I'll call it minor trend support) which has been proven as a strong support that makes the price bounce back several times since beginning of Nov 2012.
3. There's a doji (morning star) in the daily chart.

Let's take a look a little bit further in the following weekly chart:


It's even clearer when I look at the weekly chart.
Silver has touched it's 2 years support area, which has been formed since Jan 2011. Look at that grey box and look at all the arrows I put in the chart. I surely say that it is a really strong support.

I personally has opened my long position with SL at some points below grey box area. My first target is 28.3, the second target is 29.8, next target is 32, and my last target is 35 which is my highest expectation that Silver can go this year.

Other scenario, if Silver ever breaks the grey support, then it might be a real big drop up to 20 area.

Just put on your SL and good MM as the safety devices. We will see if my guess is right or wrong in several days ahead.
Have a nice weekend.

GG - 2013 04 05

Forecast - 2013 05 04


Gold has been going all the way down.
But I think it's already touch the limit and trying to bounce back up a little bit.
I see some good reasons to go Long from daily chart above:

1. A big possibility of forming the Morning Star pattern (doji)
2. RSI and William Percent Range, both are already in extreme oversold area and beginning to move up.
3. A good Reward - Risk ratio.
4. Current price is already around the support area.

Of course, as usual, use proper money management.

Good luck and have a nice trading.

GG - 2012 04 05

Selasa, 19 Maret 2013

Forecast 2013-03-19


Gold is moving up these days and was able to break 1600. But now it has already touched its Fibo 23.6%, which has been the resistance area for its last upward movement.
I think gold will make a narrow sideways around 1610, but still above 1600, at least until FOMC on this coming Wednesday.
I personally think that The Fed will not making any surprising announcement, but still gold may move big enough from the current price, whether it goes up or down.
But if I look technically only to the chart and not considering any coming news, I think gold probably will move a little bit upside, maybe to the 1620 - 1630 area, at most too its 38.2% Fibo line.

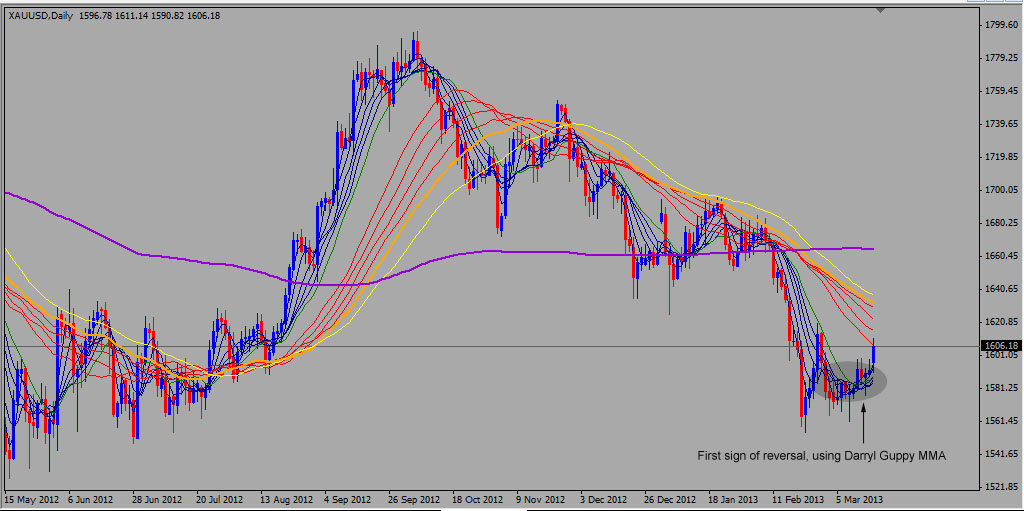
Let's take a look another daily chart using DGMMA analysis as shown in the chart below.


We can see that from Darryl Guppy Multiple Moving Average analysis all fast MA has shown a reversal by pointing upside. This is the first sign of a reversal, although it also can only mean a correction from the main downtrend. Meanwhile, all the slow MA is still pointing down which mean the uptrend is not confirmed yet.
From Momentum Analysis on GLD (SPDR Gold market in AMEX, I can't show the chart here due to the rights), I can clearly see that for the last 5 trading days, there are more Buyer than Seller in the market, which mean a sign of a bull trend (or at least, a significant correction).
Daily RSI(14) also still in neutral area that is around 51.28 in my daily chart when I write this. That means gold has not been in overbought condition yet and still have fairly chance to go a little bit further up.

My conclusion is, gold probably has more power to go up a little bit than to go down.
Please be wise. Always use stop losses and good money management.

Good luck.

GG 2013-03-19

Rabu, 06 Maret 2013

Forecast - 2013.03.06

Been busy this month. Didn't have any time to write the update in my blog.
Gold has been moving quite far since my last post on Feb 1st.


From the chart above, we can see that gold moved exactly between my white support and yellow resistance from Feb 1st (my last post) to Feb 11th. It formed a very good scalping area.
And as I predicted, gold broke the pennant on Feb 11th (in my earlier post I predicted gold would break the pennant at most before Feb 20).

Let's see the current condition.


Above is the M30 chart. We can see that gold moves sideways in a very narrow path. Since it already form a very short distance between the R/S at this moment, I think this is not an ideal time to make a position, even for scalping. The Risk-Reward ratio is not good enough.

Let's see from the long term time frame.


From the daily chart, we can see 2 very important things to notice. The first one is the Brown Resistance which is the Long Term Trend Resistance. This line is very strong and have never been broken before. I think this will be a strong resistance for some more months, probably up to mid year 2013. For me, this line will be my taking-profit Long positions.
The second important thing to pay attention is The Long Term Trend Support area (grey area). I define this as area because it spreads between 1522 to 1547 ($25 spread). This will be a good buying area for me with the stop loss a couple of $ below this area and the target a little bit below the Brown Resistance  lines.

My conclusion, gold will move sideways between Brown Resistance Line and Grey Support Area at least for this month (March).

Good luck.

GG - 2013.03.06

Jumat, 01 Februari 2013

Forecast - 2013.02.01


Exactly as expected in yesterday forecast, the bear had better chance than the bull. Gold was easily going down without any resistances up to the white support line once more.
Now it seems that the market really waits for the next step.
I still see gold is continue making its sideways and probably will bounce back up around this white support level. I expect this pennant can be a good path to make money.
Technically from R/S, I think this current price is a good entry for Long position with target below the Resistance Area and SL a little bit below the White Support. That will be a good RR ratio.
But always remember that market always has surprises and can't be 100% truly predicted.
That's why I must remind once more that the best way to trade is to use good money management.
Later today, we will have NFP. It becomes a matter if NFP data is much more different than expected. If it happens, we might have a breakout from this pennant pattern, otherwise the sideways will still there for some more days.

Trade well and good luck.

GG - 2013-02-01