
Gold is moving up these days and was able to break 1600. But now it has already touched its Fibo 23.6%, which has been the resistance area for its last upward movement.
I think gold will make a narrow sideways around 1610, but still above 1600, at least until FOMC on this coming Wednesday.
I personally think that The Fed will not making any surprising announcement, but still gold may move big enough from the current price, whether it goes up or down.
But if I look technically only to the chart and not considering any coming news, I think gold probably will move a little bit upside, maybe to the 1620 - 1630 area, at most too its 38.2% Fibo line.
Let's take a look another daily chart using DGMMA analysis as shown in the chart below.
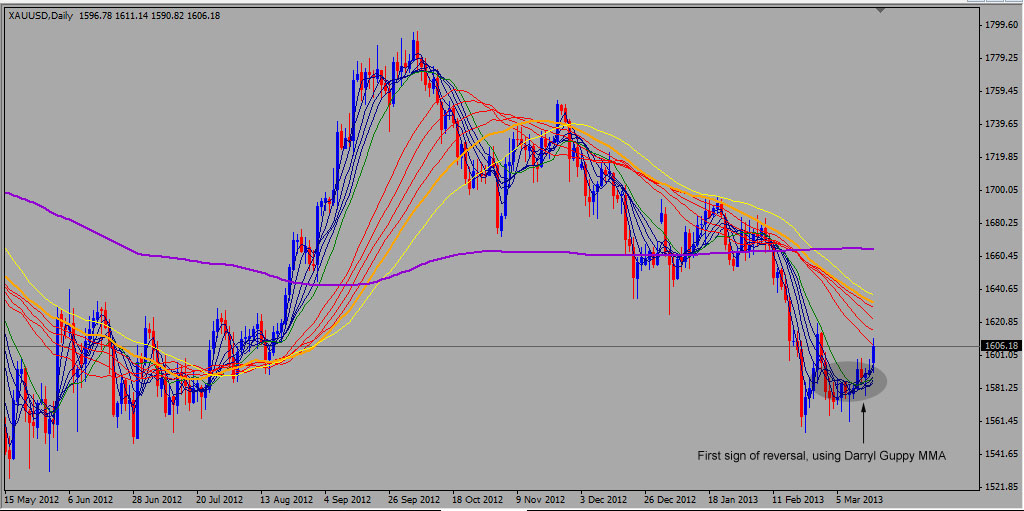
We can see that from Darryl Guppy Multiple Moving Average analysis all fast MA has shown a reversal by pointing upside. This is the first sign of a reversal, although it also can only mean a correction from the main downtrend. Meanwhile, all the slow MA is still pointing down which mean the uptrend is not confirmed yet.
From Momentum Analysis on GLD (SPDR Gold market in AMEX, I can't show the chart here due to the rights), I can clearly see that for the last 5 trading days, there are more Buyer than Seller in the market, which mean a sign of a bull trend (or at least, a significant correction).
Daily RSI(14) also still in neutral area that is around 51.28 in my daily chart when I write this. That means gold has not been in overbought condition yet and still have fairly chance to go a little bit further up.
My conclusion is, gold probably has more power to go up a little bit than to go down.
Please be wise. Always use stop losses and good money management.
Good luck.
GG 2013-03-19


