Sabtu, 30 November 2013

Forecast - 2013.11.30

A CONTRADICTION

Gold is making a confusing situation for me to guess where it is going to head.

In H1 chart, it is obvious that 1255 is a resistance area which the current price probably will make Three Tops pattern if it can't go through higher. Just check the H1 chart below.


But then, there are some contradictory clues, which are seen in the Daily chart below:


From the daily chart, there are at least 3 clues that contradicts the H1 chart which is probably making Three Tops pattern (sign of bearish). There are:
1. Price already broke the daily resistance
2. There is a Higher Low, indicates that probably gold is making a new path to the upside
3. My daily WPR and RSI are probably making a golden cross, which I usually use in daily chart as a confirmation for an uptrend.

Conclusion:
I prefer to guess the bear is not finish yet, since there is no support from the fundamental for the bull.
As long as the price not making a Higher High, which is breaking above 1258, I still hold for the bear.
We'll see soon if my guess is correct or wrong.

GG - 2013.11.30


Rabu, 27 November 2013

Personal Note - The Result


This is the result of last prediction.
Total gain = 2 positions @ 1.005 pips

GG - 2013 11 27

Forecast - 2013.11.27


From daily chart, there is an obvious downtrend path with the perfect R/S as the boundary.
But it is also clearly seen that the bearish always be rejected by the support 1 line.
There is 2 alternatives in my view.
Alt 1, the bear wins the fight. In this case, gold must break Support 1 line and  then it might continue follow the downtrend path.
Alt 2, gold breaks the resistance and makes a new uptrend path. In this case, gold must break the resistance line first. The question is, will there be enough power to support the bull? I doubt it.
Looking the fundamental base nowadays, the most likely to happen, at least from my view, is that gold will go once more to around resistance level and then go back down.
Let's see the hourly chart below.


I think gold will bounce back to the resistance area before trying to go lower since there is a support line (Support 1) that seems to be respected by the market and also the oversold condition at the moment.
But I really doubt that gold can go further up since the fundamental situation seems does not support it.
So, in this moment, I guess the best trade is to have short around the resistance area as seen in the H1 chart.
Of course as usual, get the disclaimer on.

Good luck....

GG - 2013 11 27

Rabu, 06 November 2013

Forecast - 2013.11.06

ANOTHER DIVERGENCE...!!!


At this moment we have a bullish divergence. William Percent Range and MACD indicators, both show bullish divergence.
The last time bearish divergence existed, it worked. Will it work now???
We will see soon.


AT SUPPORT LINES???


Gold goes back to its previous path, or from another point of view, it might be a beginning of a new path. Who cares?
But wait a minute, look closely!
From both points of view, the price might be near a support level. Technically it has bigger opportunity to move away from the support, right? Hahaha.... that's only an assumption. No one knows where will it go.
Let's take a closer look of the daily chart.


Yes, it might form many higher highs and lows from this view.
It also performs a Morning Star and (almost certain) Bullish Engulfing.

Ok then, I think gold has more chance to go up than down.
To what level? I suppose the key area would be the area between the blue and red resistances. Will it break that area or will it bounce back down? Let's wait and see....


Uhmm, wait a second. There will be Advanced GDP and NFP soon. I think it will have big influence of gold price. Take care and have SL and MM as your safety device. Have a nice trading.

GG - 2013.11.06

PS: Disclaimer always on!!!

Jumat, 01 November 2013

Selasa, 29 Oktober 2013

Forecast - 2013.10.29

Gold turned out not going down as I thought. But it also doesn't go up. It seems that the market is still waiting for some confirmation or significant reasons to move the price. I think the market mover will be the FOMC Statement on next Wednesday.

For this moment, this is my sight for Gold.


From the daily chart above, we can see that for the last 2 days, gold has been trying to break the daily resistance but it fail. It shows that the bull power is still not strong enough to push the market higher. Personally, I think that the upside price movement for this last 2 days is more caused by the bad result of Pending Home Sales news.
It was (Actual  Forecast  Previous) = -5.6%  0.5%  -1.6%

Let's zoom in...


From a bigger look of the same daily chart, we can see that for the last 2 days, gold has actually been trying to break the daily resistance but it seems that the power is not big enough. It makes the tails slightly over the resistance and make the body under it. It is really obvious the market is reluctant to move the price to any direction.
From my sight, I think it also means that more likely gold will go downside. This is because there are 2 resistances which in my opinion are strong enough since both resistances has never been broken before.

Let's see a closer look


From the H4 chart above, it's clearly that gold had violated the support and tried to go back into its uptrend channel but then it failed. We can see very clear that the Green Resistance that holds gold from making higher price recently. This is for me a sign that the power of bull is diminishing. But it also gives a clue that the bear is reluctant to take over the power.

Resumee:
Technically, I see that gold more likely will have a downside move because gold has 2 strong resistances at this level of price.
But, considering that FOMC Statement will be announce on Wednesday, there is a big chance that bull power will be back in the market very sudden. Why? because I have a strong feeling that the Fed will not announce any significant change of its policy. It includes the postpone of tapering. If there's no tapering, than it gives gold more advantage and push it higher. But this is only guessing. Don't trade just on it. Do your analysis.

GG - 2013.10.29


Senin, 28 Oktober 2013

Forecast - 2013.10.27 : Reason To Trade


Reason To Trade:
1. The last H4 Candle was rejected by the resistance.
2. There is a Bearish Divergence. Last time it has divergence, the price went down significantly. Will it also be like the last divergence?
3. William's Percent Range is in the extreme overbought area and begin to facing down.
4. Risk Reward Ratio seems pretty good to me.

Well, let's see where it'll go. Will it going down as predicted or it just continue going up.
Disclaimer on.

GG - 2013.10.28

Sabtu, 26 Oktober 2013

Forecast - 2013.10.26


XAU is clearly in an uptrend. The clear path is between the Red R/S trendline.
But there is another Resistance that we have to pay attention. Just see the green Resistance.
Gold has been rejected several times around that Resistance. And the last H4 candle also been rejected by the time I write this.
This H4 candle will be completely done in around 2 hours from now and will be the last H4 candle before the market close. This candle will be the key candle. If it forms a doji / inverted hammer / evening star, then I think there is a big possibility that gold will have a pullback downside a little bit.
Just take care and have a nice weekend.

GG - 2013.10.26

Minggu, 22 September 2013

Forecast - 2013.09.22

HOW LOW THE BEAR CAN GO?

After having a significant jump on Thursday, right after FOMC, gold has been plunged almost 4,400 pips.
Although I have predicted that gold could not go higher than 1375 because the Resistance was  obviously very strong (R/S Lines and Fibo, see my previous post), but I also didn't expect that gold would dive that far so quick.
Luckily, I have anticipated the move, I still could take profit.
Now, let's see the eternal question that always pops up everyday, where the gold will go next?

From H4 Chart, we can see that gold has touched 61,8% fibo and went up a bit before it closed.


Zooming to H1, we can see that the last bar formed a very small pinbar.
Although this is not a very clear sign of reversal, I think we also can't ignore this. I suspect gold down move can be restrained around this area.
But to say that it will go up or down, we need more confirmation.
If I have to guess, I think gold more likely to go up than to go down. Let's see tomorrow.

Let's see one more chart.
I put the previous Fibonacci (originally used to measure the spike last Thursday), we also can see that gold closed exactly at the 23,6% Fibo.
That was an interesting "coincident".
Or is it a sign? :)


My conclusion:
More likely gold will not go lower and possibly it'll go a little bit upside.
Disclaimer on.

GG - 2013.09.22

Jumat, 20 September 2013

Forecast - 2013.09.20

HOW FAR THE BULL WILL GO?

Last FOMC yesterday (Thursday, Sep 19, 2013), The Fed announced that they maintain QE and didn't do the tapering. As the result all pairs moved significantly and gold also jumped instantly.
The question is, to what level?
At the time I write this forecast, gold is running around 1372.
Let's try to analyze gold move.

Daily Chart No. 1
Analyzing tools: Fibo and Trend Line
Look at the daily chart no.1
It is interesting to see today that gold's daily move is limited by the Resistance that also acts as previous Uptrend Support (blue line).
As we can see, the gold's stuck exactly by 2 significant technical tools that is 61,8% Fibonacci Lines and R/S Lines.


Daily Chart No. 2
Analyzing tools: the same as no. 1 (Fibo and Trend Line)
Actually, this is not the right way to use Fibo for current moves. This fibo is used to measure the previous downtrend. But I like to show you the interesting fact that by using the previous fibo, we can see that gold uptrend moves is also restrain exactly by 23,6% Fibo lines that cross exactly with the trend lines (blue lines).


Daily Chart No. 3
Analyzing tools: Chart Pattern
By the time I capture this chart, there is still 3,5 hours left to complete this daily bar. It's interesting to guess, whether today bar will be a Pinbar (Evening Star) pattern, or will it be able breaking through all the resistances (Fibo and trendline, as no. 1+2 above)


M5 Chart
Look at the Light Grey box at the upper side of the chart.
From this M5 Chart, we can see that gold has been trying 4 times to break the resistance area (grey area), which also the same level as Fibo in no.1 and no.2 above.
Interesting isn't it?


My conclusion:
There are 2 alternatives.
1. Gold fails to break this Resistance Area and going down a little bit. If this happens, I don't think gold will drop much since we already know that tapering is cancelled for this moment and there is no certainty when the Fed will start tapering. So, I believe gold won't go all the way down in the short time.
2. Gold manages to break the resistance. Then the next resistance area will be around 1385-1390. I doubt it will go further than that for this week.

For me, the most possible scenario is that gold will make a sideways move between 1360 and 1375 area.
I will trade tick-tack between this area, buying at support and selling at resistance. Just beware if the price manages to break this temporary area. If that happens, just switching the position and get along with the breakout.

As usual, please keep in mind that this is only my prediction. Do not trade based on my prediction only because I do mistakes too. Disclaimer on.

Good luck.

GG - 2013.09.20

Sabtu, 10 Agustus 2013

Forecast - 2013.08.10

After being absent for some time, finally I am able to find time to post my forecast.
Gold had been really pushed all the way down and now it seems that the bull is fighting back.
Let's take a look at the weekly chart below


Gold had been extremely bearish for weeks. There was a time when gold tried to break the support of the downtrend path on mid of April but it was rejected and the price went back into the path.
The second time it tried to break the support and once again rejected by the market and the price went up this time. The interesting thing is that gold has been moving between the 23.6 and 38.2 fibo lines. It looks for me that market has not decided yet where gold must go. In this kind of situation, I think some big news can play a big role of defining where gold will go.

Now, let's zoom to the daily chart as seen below.


I think gold is making a wide sideways move. It is too early to say that it will go up yet because I see a very strong resistance around 38.2 fibo lines. Almost 2 weeks gold has been trying to break this resistance area (grey color) and hasn't been succeeded yet. But if it successfully breaks this area, I will not be amazed to see a strong move up to 1480-1490 area.
Meanwhile, more likely gold will move a little bit sideways with tendency a little bit down between 2 lines as drawn on the chart.
Actually, this is a perfect condition for me for applying the Scalping Path Method. It suits more in sideways rather than trending market. Since June 20th (about 1.5 months), it's already gave me 63.5% profit in one of my gold micro account.


GG - 2013.08.10

Kamis, 30 Mei 2013

Forecast - 2013.05.30


As predicted in the last posting, both Gold and Silver (not shown here) form morning star chart pattern and the price goes up.
My timing entry when gold break resistance at 1398.

Question: when will it go next?
From weekly chart it is obvious to see that gold has just begun to move from oversold area, so I think it will move more to the upside. Let's see to a smaller TF, H4 chart below.

 
From the H4 chart, we can see clearly that gold form a nicely shape Higher Low base., showing that this uptrend is strongly supported.
But in this H4 chart, we also can see a resistance, actually 2 resistances for me and RSI + William % Range also shows overbought in H4 TF.
In my opinion, gold will have some pullback, but not too far. It might go once again around its up-sloped support and then bounce back to the north, since the weekly chart is still shows extreme Oversold condition.
Let's see.

PS: Disclaimer ON.

Good luck.

GG - 2013.05.30

Jumat, 24 Mei 2013

Forecast - 2013 05 24

IS THIS THE RIGHT MOMENT OF THE "BULL"?

For the past few weeks, we've been watching how the Bear beat the Bull so hard.
The drop of the gold price is the the worst drop ever for the last 30 years. Nobody knows exactly what the true reason is. I will not try to look for the reason, I just want to try to predict the next move of the gold.

Let's start....

Analysis No.1

This is my gold weekly chart. It is a plain chart with only RSI and William % Range in other window.


Many traders often underestimate these indicators and consider them as lagging indicators. Yes it is, IF, you are a short term trader, but not for medium or long term trader.
I love these indicators because they tell the condition of the market, whether it is overbought or over sold. Of course I will not make the lesson about these indicators here, just googling and learn it by yourself.
The point is, when the market is overbought USUALLY the price will going down, and vice versa, if the market is oversold USUALLY it will then going up. If you don't believe me, just look carefully at the chart above and you can notice that both indicators tell exactly the same.
Now, please look carefully from that Weekly Chart, RSI (the red line) is in the extreme OVERSOLD area (under 30). The last time weekly RSI in this oversold area is in the September 1999. Almost 14 YEARS AGO !!!
The William % Range (with different algorithm to calculate overbought and oversold, but similar result), also in the extreme oversold area.
Both indicators point that this is a set up for bullish.
Wait a minute!!! Of course I know your objection. When these indicators are in the oversold area, such as this moment, it is not automatically show that the price will go up instantly. I know there is an exception. In a very strong trend, as can be seen in the same chart above, these indicators, sometime, can stay in the oversold area but the price is keep going down, and vice versa. Yes, I know that.
But please judge by yourself, are we in a very strong bearish trend now?

Analysis No.2

Silver - weekly

Gold - weekly

Let's see Silver and Gold weekly chart. If today (end of week) closing, silver and gold price doesn't go much lower than current-chart-low, there's a probability that it will make a Morning Star pattern.

Analysis No.3

This is the most convincing data that I have so far.


Look at the chart above. That is the weekly chart with 2 indicators, the Open Interest and the Commitment of Trader. Both data are official data from US CFTC (US Commodity Futures Trading Commission), the official US government bureau that collect weekly commodities data, including gold, from all US market.
I will not share how to use these data here. For those who has known the important of these data in the trading will know what I mean. (Please find a way to get assistance from around you to  learn how to use these as it is impossible to share the knowledge here).
The point that I want to show  here is, that we are having the similar conditions compare to the end of year 2008 when gold begun a long rally.
The Open Interest shows the lowest figure (significant drop in the last 2 weeks) and the Commercial shows the highest figures, both since the end of 2008, when the gold rally begun.
Why it is so important? Because the Commercial is the market mover. No one can beat them, not the large trader nor the speculators.
Both indicators show the set up for a bullish gold price. Of course it doesn't mean the bullish will happen tomorrow, but the most important thing is, we already have the signal that a bullish setup for gold is near.
Just be prepared .

Analysis no.4

One of my favorite traders is Larry Williams. Actually, I learn about COT, Open Interest, and many more indicators because of his book, Cracking The Money Code. I found it very helpful and logic. Some of his secrets of being successful trader is because he use the reliable and valid data. So trading is not only about luck. It is about what reasons you have to make a smart speculation.
One of his tools is Advisory Sentiment Index. Sorry I don't have anything to show here about this tool.
The point is, when most of the advisers, media, brokers, anyone, are bullish then probably we are already in the market top. Vice versa, when most are bearish, probably we are already in the bottom of the market.
Now, let's think about it, how many experts or people have you heard are bullish about gold lately? None?
Yup... Everyone is really bearish at these moment. Is this a sign?
You decide....


My Conclusions

Yes, I'm begin to be bullish at this moment. Now I'm preparing myself to face at least a significant correction of the gold price (and also silver) if we can't say a rally.
Of course as I say earlier, it might not happen next week. It might happen next month. It might also the gold price can drop further. But at least, the set up for bullish conditions is already there.
Always use a good money management and discipline.
Wish all of you have nice profit.

Note: Disclaimer always ON.


GG - 2013 05 24

Selasa, 14 Mei 2013

A Sample of Trading Using My Method


This is a sample of trading using my method.

In the above sample, we should have been able to define a scalping path after 4 Tops and 4 Bottoms (T4 and B4) happened. There was a clear R/S line we can draw. As for me the R/S line doesn't have to be drawn between low to low or high to high very exact. The most important thing is that line represent some tiny area where price bounces back to other direction. As we can see, this sample represents a narrowing sideways move. We can tell because the path was formed by the Lower High and Higher Low. In this case we can open both Long or Short positions.

The Entry Point 1 (for Short position) was taken because the price had already touched the Resistance and the William % Range was already in extreme Overbought area though the RSI was not. The timing is when the W%R was already pointing down.
The Stop Loss was put above the Resistance.

The Entry Point 2 (for Long Position), which also became the Taking Profit for Position 1 (TP1, for Entry Point 1), was taken because the price had already touched the Support line and both RSI and W%R were in extreme Oversold area. I put SL some point under Support line.
The target for the Entry Point 2 (Long Position) was TP2 which was a little bit below Resistance.
To maximize the profit, we can delete the TP and change it with Trailing Stop.

For me, the Entry Point 2 was far better than Entry Point 1 because it has more conditions fulfilled.
Scalping Path can be drawn perfectly, Price touched the R/S, both W%R and RSI in extreme Oversold area.

Good Luck


GG - 2013 05 13

Kamis, 09 Mei 2013

Hasil Trading Emas Selama 11 Hari

Ini adalah hasil saya trading emas selama 11 hari dengan menggunakan kombinasi dari Scalping Path, R/S, indikator RSI dan William Percent Range, dan juga Chart Pattern.

Langkah-langkahnya:

1. Menentukan Scalping Path
Langkah ini adalah yang paling penting sebelum melakukan seluruh proses. Diperlukan kesabaran untuk menunggu terbentuknya sebuah scalping path yang jelas. Terlalu cepat akan mengakibatkan kesalahan timing masuknya, terlalu lambat akan mengakibatkan scalping path sudah di-break. Menurut pengamatan saya, 3 kali Top dan Bottom umumnya sudah cukup solid memberikan konfirmasi terbentuknya sebuah scalping path. Atau bisa juga melihat lanjutan R/S sebelumnya apabila memang sudah ada.
Time Frame 5 menit untuk menentukan Scalping Path.
Jarak antara Top dan Bottom harus diperhitungkan juga spread nya.
Scalping Path biasa terbentuk ketika keadaan pasar sedang tenang, yaitu di saat tidak adanya high impact news. Waktunya bisa kapan saja di market manapun. Namun demikian, pada saat market NY mulai, scalping path bisa ke-break. Jadi sebaiknya tidak mengambil posisi dekat dengan pembukaan market NY.
Penting untuk diingat, jangan memaksakan buka posisi bila scalping path yang terbentuk tidak jelas.

Catatan khusus (untuk teknik breakout pada saat NY buka):
Pengambilan posisi yang terbaik pada saat market NY buka adalah mengikuti trend hari itu. Bila current price beberapa menit sebelum NY buka mendekati high hari itu maka kemungkinan besar harga akan naik, sebaliknya bila current price mendekati low hari itu, maka harga cenderung untuk turun.

2. Penentuan Trend
Sangat penting juga diketahui trend yang sedang berjalan saat mau buka posisi. Untuk penentuan trend ini harus dilihat dari H4 dan H1. Sebaiknya penentuan posisi buy atau sell harus disesuaikan dengan trend saat itu. Bila trend bullish, maka sebaiknya buka hanya posisi buy pada saat harga mendekati support di scalping path, sebaliknya bila bearish maka sebaiknya buka hanya posisi sell pada saat harga mendekati resistance scalping path.
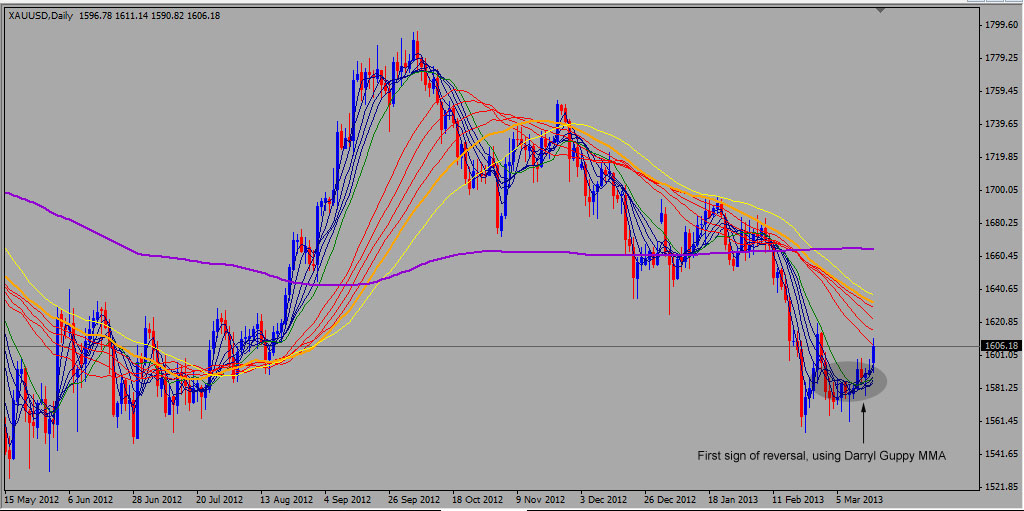
Catatan: Penentuan trend ini masih kurang memuaskan.Penggunaan MA tidak memberikan hasil yang memuaskan karena selalu terlambat (lagging). Sementara masih lebih baik dengan melihat Higher High / Higher Low uuntuk uptrend atau Lower High / Lower Low untuk downtrend yang dikombinasi dengan Fibonacci atau Chart Pattern atau Trend di time frame daily atau H4.

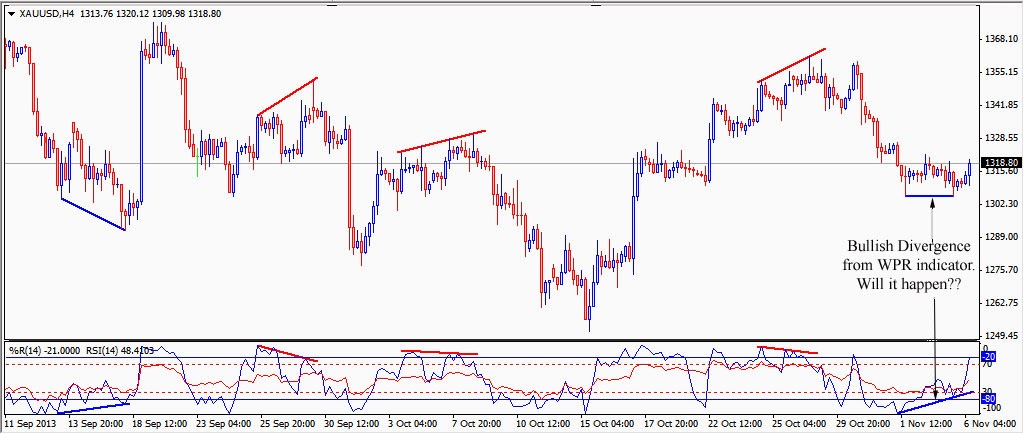
3. RSI dan William Percent Range (W%R)
Masukkan oscillator indikator RSI (14) dengan input level 30 dan 70 ditambah dengan William Percent Range (14) dengan input level -20 dan -80 ke dalam 1 jendela indikator.

4. Open Posisi
Untuk membuka posisi, bukan hanya ditentukan oleh R/S pada scalping path saja tetapi harus melihat kepada keadaan RSI dan W%R.
Akurasi tertinggi hanya terjadi pada saat harga mendekati R/S dan kedua indikator dalam keadaan overbought / oversold yang telah mulai berbalik arah. Bila ini terjadi di beberapa time frame, misalnya terjadi di H1, M30, M15, dan M5, maka posisi tersebut kemungkinan sangat besar akan tepat. Kuncinya adalah makin banyak time frame yang menunjukan kesamaan, maka makin besar ketepatannya. Namun hal ini sangat jarang terjadi.
Yang lebih sering terjadi dan tidak boleh dilanggar dalam membuka posisi adalah paling tidak RSI dan W%R menunjukkan keadaan overbought / oversold di M5 pada saat harga berada sekitar R/S.
Bila di M5 saja tidak menunjukkan overbought / oversold walaupun harga sudah ada di R/S, maka sebaiknya jangan buka posisi karena akurasinya sangat rendah.
Apabila kondisi RSI dan W%R seperti yang disebut di atas sudah terjadi dan ditambah lagi adanya Chart Pattern atau Price Action maka hampir dapat dipastikan posisi tersebut sangat akurat.
Hal lainnya yang penting diingat adalah rasio Risk-Reward. Paling tidak harus 1:1. Bila aturan di atas diikuti dengan disiplin, seharusnya rasio RR minimal 1:1 tersebut bisa dicapai. Bahkan seringkali Risk:Reward bisa mencapai 1:2, 1:3, atau bahkan lebih dari itu.
Ingat, selalu gunakan Money Management yang baik. Setiap dari kita mengharapkan keuntungan, tetapi kita perlu sadar bahwa yang harus kita persiapkan adalah kalau kita mengalami kerugian. We wish for the best but we prepare for the worst. Jadi, siapkan berapa persen yang anda rela untuk hilang kalau posisi anda salah. Saya pikir 3-5% resiko per trading sudah cukup besar. Sesuaikan lot yang bisa anda buka dengan resiko tersebut.
Catatan: sejauh ini kerugian saya terbesar 5,1% dengan rata-rata kerugian 2,6%.


5. Taking Profit dan Stop Loss
TP adalah beberapa point sebelum R/S, dan SL adalah beberapa point sesudah R/S. Harap diperhitungkan spread nya.
Untuk memaksimalkan profit, bila harga sudah mendekati TP, maka TP bisa dihapus dan gunakan Trailing Stop.
Yang paling penting dan tidak boleh dilanggar adalah selalu harus memasang SL karena teknik ini adalah scalping dengan menggunakan scalping path pada time frame M5 yang akan sangat sering di break sewaktu-waktu. Selain itu target TP yang kecil. Sangat riskan bila tidak menggunakan SL karena kalau sampai scalping path di break dan tidak memasang SL, maka loss yang terjadi bisa sangat besar.
Tentunya kita tidak mau profit kecil berkali-kali langsung habis dihajar loss sekali saja.
Ingat, scalping path sangat sering terjadi. Kalau kali ini kita salah ya sudah relakan saja karena masih ada kesempatan lain.

6. Serakah (greed), Takut (fear), Kesabaran (patience), Disiplin (discipline)
Dari pengalaman saya selama ini, yang paling sulit untuk diatasi adalah kondisi psikologis saya yaitu Greed dan Fear. Kedua hal tersebut bisa diatasi dengan cara sedikit mungkin melihat chart.
Padahal dalam menggunakan scalping path, kita dituntut untuk melihat chart jauh lebih sering dan lebih lama dibandingkan medium atau long term trader. Oleh karena itu, perlu ditekankan disini Kedisiplinan.
Jangan sekali-sekali melanggar aturan yang telah ditetapkan.
Yang perlu diingat juga adalah, bila kita sudah kena cutloss jangan langsung segera ingin buka posisi lagi. Biasanya bila SL kita kena, itu karena scalping path sudah di-break. Dilarang keras untuk langsung "balas dendam" dengan membuka posisi baru. Dibutuhkan kesabaran untuk menunggu terbentuknya sebuah scalping path yang baru.
Bukankah lebih baik menunggu lebih lama untuk punya posisi yang bagus daripada sudah memiliki posisi tapi dalam keadaan floating loss.
Dari pengalaman pribadi saya dan mengamati banyak teman-teman trader baik yang sukses maupun yang gagal, saya berkesimpulan bahwa yang membedakan trader sukses dan trader gagal bukanlah di teknik atau pengetahuan yang dimiliki melainkan di faktor psikologis masing-masing yaitu Greed, Fear, Discipline, Patience. Faktor psikologis jugalah yang menentukan apakah money management dijalankan dengan baik atau tidak. Inilah awal dari kesuksesan atau kegagalan seorang trader.


Demikianlah garis besar dari teknik trading saya selama ini dengan contoh hasil seperti yang terlampir di atas. Tentunya kita harus ingat bahwa tidak ada yang namanya teknik yang sempurna 100%, there is no holy grail in trading.
Sering sekali saya melihat seorang trader berusaha mempelajari segala macam teknik yang sangat rumit dan membayar seminar bernilai ribuan dolar. Banyak juga trader yang membeli robot dengan sangat mahal. Lucu. Padahal dari pengalaman, saya melihat bahwa untuk menghasilkan profit yang konsisten seringkali tidak diperlukan teknik yang aneh dan rumit, tetapi hanya sebuah sistem yang sederhana dan kedisiplinan yang tinggi. Namun karena terlalu sederhananya sistem tersebut, banyak orang yang tidak percaya bahwa itu bisa berhasil.
Dengan menggunakan prinsip-prinsip yang sama pun, hasil trading antar 2 orang pasti berbeda karena di dalam trading bukan hanya teknik yang menentukan tetapi juga kondisi psikologis yang berperan sangat besar.
Akhir kata, saya bukan hendak menyombongkan diri dengan postingan ini atau menggurui para pembaca. Tujuan saya adalah hanya men-sharing-kan apa yang selama ini saya dapatkan dari pengalaman saya trading dengan harapan bahwa pengalaman ini bisa berguna bagi orang lain.
Semoga postingan ini bisa bermanfaat.

Good luck.....

GG - 2013 05 09

Selasa, 30 April 2013

Update - 5 Days Result of Scalping Path


Just an update of the result from 5 Days using my old technique with some additional modification.

GG - 2013.04.30

5 Days Result of Scalping Path - 2013.04.30


JUST FOR PERSONAL RECORD.

This is my 5 Days Result of Scalping Path.

It's been a good result so far but I'm not too satisfy because some of the profitable position made me put a big distance SL. This mean that sometimes I still enter at the wrong time that market can drag my positions to the wrong direction before going to the right one. Whether I'm too early to get in or I'm wrong. Have to improve this problem

I also find out that to improve the accuracy, it's better define the direction first. Do this in longer time frame (H4 or H1 at least) before opening a scalp position.
Open Long is better when trending is up, Short much better when market is down.
Meanwhile, still defining the trend by the classic method: SMA 24 for H1


GG - 2013.04.30

Sabtu, 27 April 2013

3 Days Scalping Path Result - 2013.04.26


3 Days result of scalping path.

Things to remember (for my personal note only)*:
1. Stick to the rules strictly. DO NOT enter when the price is in the middle of a range.
2. Wait till obvious R/S has been formed. Patience is the key. Do not rush nor late. Watch the timing for OP. Can use the trailing stop to maximize the profit.
3. First W%R then RSI. both in M5 and M15. OP only when both touch my target R/S.
Both indicators in H1 are only for the confirmation of longer trend.
4. Safer avoid NY Market. Noon in my time is better to scalp. Avoid high impact news. Works better in sideways.

Homeworks to do:
1. Still can't define the ideal SL. If it too close then it it easily being executed. Too far, then exceed my RR ratio and makes my drawdown exceed my target.
2. Have to try MA R/S and the ideal setting.
3. Try to increase the accuracy by combining more indicators if necessary (trial and error).

*) Notes for the readers: Sorry, these are only for my personal notes to remind me of the scalping system I'm developing right now. Since this is still in the progress of trial and error, I can't share it yet. Just ignore this posting since it is really for my personal use.
Maybe someday I'll share my scalping technique if I already satisfied of the result and consistently make the profits.

GG - 2013 04 26

Kamis, 25 April 2013

Special Notes and A Reminder of Scalping Path


SILVER DAILY

GOLD DAILY

Silver and Gold had unexpected moves that beyond my technical. Of course there were many opinions, but I'd rather said that was a panic selling in the market. I didn't expect gold and silver would drop that far. It was the deepest drop (gold) for the last 30 years. And they said that many were loss.


Okay, it was history....
Everything has passed and we have taken the lessons. STOP LOSS AND MONEY MANAGEMENT works as the safety devices when unexpected things happen.

Let's take a look for gold now.
From the daily chart above, just notice the RSI and William Percent Range both are in the extreme oversold area. It was pretty rare that the RSI goes below 20, even more touch 14.70 (see the chart above). And it turned out to be true that gold rebound in that area.
If we use the Fibonacci to predict how far gold will rebound upside, we can see that for the last 3 days, gold is stopped by the 23.6% line (around 1430). I think this will become a new resistance area.
It still too early to say where gold will go from this area. If gold can break this resistance area and go higher than 1440, I think it could go to test 1500.
But if gold can't break this area, there is a possibility that it would go lower than 1400.
In the condition like this, I'd like to remind the old technique of mind, Scalping Path....

Now, this is just a reminder of how I do my business, the gold trading...

SCALPING PATH

As I mention in my several old posts, I'd like to do scalping in the sideways move or in the day when there is no big impact news. Gold movement is easily predicted in the day like this. It is as simple as making the support and resistance. (Just look for my post about scalping path). I'd like to call this kind of day as A Scalping Path Day. Just got 813 pips from 6 times scalping. Who says scalping is bad :D
There's plenty of scalping days in gold market. Learn how to scalp, and buckle up (SL and MM)....

Good Luck.

GG - 2013.04.25

Kamis, 11 April 2013

Silver, an Exception Forecast - 2013.04.11


Continuing my post about Silver, these are my additional prediction about Silver:
  1. From the daily chart above, I can see that there is a clear Bullish Divergence shows up, that means most likely Silver is making a reversal, or at least a significant correction to the north. I think the journey to the north is not over yet.
  2. Silver has entered the very strong support level area at price 26 which means there should be a bounce happens.
  3. There is big probability, Silver will go up to at least the area of 23.6% Fibo which has also been the sideways area for more than one month (grey ellipse), from 20 Feb to the last week of March. I think Silver will enter and test this area, which now acting as resistance area. This area will be my first taking-profit area.
Of course this is only my own technical prediction, which means it is not a 100% must-be-happened-truly. Since I'm still a human, there is still a chance that I make mistake.
So, as usual, keep good MM and put SL as your safety devices.
Trade well....

GG - 2013.04.11

Selasa, 09 April 2013

Personal Record, The Result of Previous Forecast - Silver and Gold

SILVER - Daily

GOLD - Daily

Just for personal record, when I post this:

* Silver has moved up as predicted to 28.065 from 27.143
* Gold has moved up as predicted to 1590.48 from 1567.89

GG - 2013.04.09

Jumat, 05 April 2013

Special Note about Silver

This is really a special note because I'm not writing about gold here.
Instead, I'm talking about Silver, because I can't stand not to mention it in my blog with all this perfect technical conditions.


I've been waiting for some days for this moment. I really think that this is the time to go long with silver.
Just look at those all technicals in the Daily chart above.

1. RSI and William Percent Range are in the extreme oversold area and begin to move up.
2. The price has touched it's trend support (I'll call it minor trend support) which has been proven as a strong support that makes the price bounce back several times since beginning of Nov 2012.
3. There's a doji (morning star) in the daily chart.

Let's take a look a little bit further in the following weekly chart:


It's even clearer when I look at the weekly chart.
Silver has touched it's 2 years support area, which has been formed since Jan 2011. Look at that grey box and look at all the arrows I put in the chart. I surely say that it is a really strong support.

I personally has opened my long position with SL at some points below grey box area. My first target is 28.3, the second target is 29.8, next target is 32, and my last target is 35 which is my highest expectation that Silver can go this year.

Other scenario, if Silver ever breaks the grey support, then it might be a real big drop up to 20 area.

Just put on your SL and good MM as the safety devices. We will see if my guess is right or wrong in several days ahead.
Have a nice weekend.

GG - 2013 04 05

Forecast - 2013 05 04


Gold has been going all the way down.
But I think it's already touch the limit and trying to bounce back up a little bit.
I see some good reasons to go Long from daily chart above:

1. A big possibility of forming the Morning Star pattern (doji)
2. RSI and William Percent Range, both are already in extreme oversold area and beginning to move up.
3. A good Reward - Risk ratio.
4. Current price is already around the support area.

Of course, as usual, use proper money management.

Good luck and have a nice trading.

GG - 2012 04 05

Selasa, 19 Maret 2013

Forecast 2013-03-19


Gold is moving up these days and was able to break 1600. But now it has already touched its Fibo 23.6%, which has been the resistance area for its last upward movement.
I think gold will make a narrow sideways around 1610, but still above 1600, at least until FOMC on this coming Wednesday.
I personally think that The Fed will not making any surprising announcement, but still gold may move big enough from the current price, whether it goes up or down.
But if I look technically only to the chart and not considering any coming news, I think gold probably will move a little bit upside, maybe to the 1620 - 1630 area, at most too its 38.2% Fibo line.

Let's take a look another daily chart using DGMMA analysis as shown in the chart below.


We can see that from Darryl Guppy Multiple Moving Average analysis all fast MA has shown a reversal by pointing upside. This is the first sign of a reversal, although it also can only mean a correction from the main downtrend. Meanwhile, all the slow MA is still pointing down which mean the uptrend is not confirmed yet.
From Momentum Analysis on GLD (SPDR Gold market in AMEX, I can't show the chart here due to the rights), I can clearly see that for the last 5 trading days, there are more Buyer than Seller in the market, which mean a sign of a bull trend (or at least, a significant correction).
Daily RSI(14) also still in neutral area that is around 51.28 in my daily chart when I write this. That means gold has not been in overbought condition yet and still have fairly chance to go a little bit further up.

My conclusion is, gold probably has more power to go up a little bit than to go down.
Please be wise. Always use stop losses and good money management.

Good luck.

GG 2013-03-19

Rabu, 06 Maret 2013

Forecast - 2013.03.06

Been busy this month. Didn't have any time to write the update in my blog.
Gold has been moving quite far since my last post on Feb 1st.


From the chart above, we can see that gold moved exactly between my white support and yellow resistance from Feb 1st (my last post) to Feb 11th. It formed a very good scalping area.
And as I predicted, gold broke the pennant on Feb 11th (in my earlier post I predicted gold would break the pennant at most before Feb 20).

Let's see the current condition.


Above is the M30 chart. We can see that gold moves sideways in a very narrow path. Since it already form a very short distance between the R/S at this moment, I think this is not an ideal time to make a position, even for scalping. The Risk-Reward ratio is not good enough.

Let's see from the long term time frame.


From the daily chart, we can see 2 very important things to notice. The first one is the Brown Resistance which is the Long Term Trend Resistance. This line is very strong and have never been broken before. I think this will be a strong resistance for some more months, probably up to mid year 2013. For me, this line will be my taking-profit Long positions.
The second important thing to pay attention is The Long Term Trend Support area (grey area). I define this as area because it spreads between 1522 to 1547 ($25 spread). This will be a good buying area for me with the stop loss a couple of $ below this area and the target a little bit below the Brown Resistance  lines.

My conclusion, gold will move sideways between Brown Resistance Line and Grey Support Area at least for this month (March).

Good luck.

GG - 2013.03.06