Rabu, 27 November 2013
Forecast - 2013.11.27
From daily chart, there is an obvious downtrend path with the perfect R/S as the boundary.
But it is also clearly seen that the bearish always be rejected by the support 1 line.
There is 2 alternatives in my view.
Alt 1, the bear wins the fight. In this case, gold must break Support 1 line and then it might continue follow the downtrend path.
Alt 2, gold breaks the resistance and makes a new uptrend path. In this case, gold must break the resistance line first. The question is, will there be enough power to support the bull? I doubt it.
Looking the fundamental base nowadays, the most likely to happen, at least from my view, is that gold will go once more to around resistance level and then go back down.
Let's see the hourly chart below.
I think gold will bounce back to the resistance area before trying to go lower since there is a support line (Support 1) that seems to be respected by the market and also the oversold condition at the moment.
But I really doubt that gold can go further up since the fundamental situation seems does not support it.
So, in this moment, I guess the best trade is to have short around the resistance area as seen in the H1 chart.
Of course as usual, get the disclaimer on.
Good luck....
GG - 2013 11 27
Rabu, 06 November 2013
Forecast - 2013.11.06
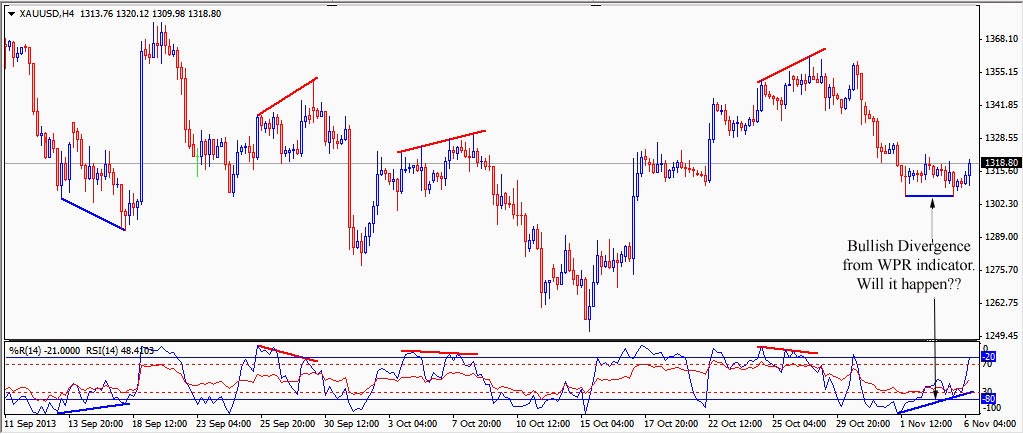
ANOTHER DIVERGENCE...!!!
At this moment we have a bullish divergence. William Percent Range and MACD indicators, both show bullish divergence.
The last time bearish divergence existed, it worked. Will it work now???
We will see soon.
AT SUPPORT LINES???
Gold goes back to its previous path, or from another point of view, it might be a beginning of a new path. Who cares?
But wait a minute, look closely!
From both points of view, the price might be near a support level. Technically it has bigger opportunity to move away from the support, right? Hahaha.... that's only an assumption. No one knows where will it go.
Let's take a closer look of the daily chart.
Yes, it might form many higher highs and lows from this view.
It also performs a Morning Star and (almost certain) Bullish Engulfing.
Ok then, I think gold has more chance to go up than down.
To what level? I suppose the key area would be the area between the blue and red resistances. Will it break that area or will it bounce back down? Let's wait and see....
Uhmm, wait a second. There will be Advanced GDP and NFP soon. I think it will have big influence of gold price. Take care and have SL and MM as your safety device. Have a nice trading.
GG - 2013.11.06
PS: Disclaimer always on!!!
At this moment we have a bullish divergence. William Percent Range and MACD indicators, both show bullish divergence.
The last time bearish divergence existed, it worked. Will it work now???
We will see soon.
AT SUPPORT LINES???
Gold goes back to its previous path, or from another point of view, it might be a beginning of a new path. Who cares?
But wait a minute, look closely!
From both points of view, the price might be near a support level. Technically it has bigger opportunity to move away from the support, right? Hahaha.... that's only an assumption. No one knows where will it go.
Let's take a closer look of the daily chart.
Yes, it might form many higher highs and lows from this view.
It also performs a Morning Star and (almost certain) Bullish Engulfing.
Ok then, I think gold has more chance to go up than down.
To what level? I suppose the key area would be the area between the blue and red resistances. Will it break that area or will it bounce back down? Let's wait and see....
Uhmm, wait a second. There will be Advanced GDP and NFP soon. I think it will have big influence of gold price. Take care and have SL and MM as your safety device. Have a nice trading.
GG - 2013.11.06
PS: Disclaimer always on!!!
Jumat, 01 November 2013
Selasa, 29 Oktober 2013
Forecast - 2013.10.29
Gold turned out not going down as I thought. But it also doesn't go up. It seems that the market is still waiting for some confirmation or significant reasons to move the price. I think the market mover will be the FOMC Statement on next Wednesday.
For this moment, this is my sight for Gold.
From the daily chart above, we can see that for the last 2 days, gold has been trying to break the daily resistance but it fail. It shows that the bull power is still not strong enough to push the market higher. Personally, I think that the upside price movement for this last 2 days is more caused by the bad result of Pending Home Sales news.
It was (Actual Forecast Previous) = -5.6% 0.5% -1.6%
Let's zoom in...
From a bigger look of the same daily chart, we can see that for the last 2 days, gold has actually been trying to break the daily resistance but it seems that the power is not big enough. It makes the tails slightly over the resistance and make the body under it. It is really obvious the market is reluctant to move the price to any direction.
From my sight, I think it also means that more likely gold will go downside. This is because there are 2 resistances which in my opinion are strong enough since both resistances has never been broken before.
Let's see a closer look
From the H4 chart above, it's clearly that gold had violated the support and tried to go back into its uptrend channel but then it failed. We can see very clear that the Green Resistance that holds gold from making higher price recently. This is for me a sign that the power of bull is diminishing. But it also gives a clue that the bear is reluctant to take over the power.
Resumee:
Technically, I see that gold more likely will have a downside move because gold has 2 strong resistances at this level of price.
But, considering that FOMC Statement will be announce on Wednesday, there is a big chance that bull power will be back in the market very sudden. Why? because I have a strong feeling that the Fed will not announce any significant change of its policy. It includes the postpone of tapering. If there's no tapering, than it gives gold more advantage and push it higher. But this is only guessing. Don't trade just on it. Do your analysis.
GG - 2013.10.29
For this moment, this is my sight for Gold.
From the daily chart above, we can see that for the last 2 days, gold has been trying to break the daily resistance but it fail. It shows that the bull power is still not strong enough to push the market higher. Personally, I think that the upside price movement for this last 2 days is more caused by the bad result of Pending Home Sales news.
It was (Actual Forecast Previous) = -5.6% 0.5% -1.6%
Let's zoom in...
From a bigger look of the same daily chart, we can see that for the last 2 days, gold has actually been trying to break the daily resistance but it seems that the power is not big enough. It makes the tails slightly over the resistance and make the body under it. It is really obvious the market is reluctant to move the price to any direction.
From my sight, I think it also means that more likely gold will go downside. This is because there are 2 resistances which in my opinion are strong enough since both resistances has never been broken before.
Let's see a closer look
From the H4 chart above, it's clearly that gold had violated the support and tried to go back into its uptrend channel but then it failed. We can see very clear that the Green Resistance that holds gold from making higher price recently. This is for me a sign that the power of bull is diminishing. But it also gives a clue that the bear is reluctant to take over the power.
Resumee:
Technically, I see that gold more likely will have a downside move because gold has 2 strong resistances at this level of price.
But, considering that FOMC Statement will be announce on Wednesday, there is a big chance that bull power will be back in the market very sudden. Why? because I have a strong feeling that the Fed will not announce any significant change of its policy. It includes the postpone of tapering. If there's no tapering, than it gives gold more advantage and push it higher. But this is only guessing. Don't trade just on it. Do your analysis.
GG - 2013.10.29
Senin, 28 Oktober 2013
Forecast - 2013.10.27 : Reason To Trade
Reason To Trade:
1. The last H4 Candle was rejected by the resistance.
2. There is a Bearish Divergence. Last time it has divergence, the price went down significantly. Will it also be like the last divergence?
3. William's Percent Range is in the extreme overbought area and begin to facing down.
4. Risk Reward Ratio seems pretty good to me.
Well, let's see where it'll go. Will it going down as predicted or it just continue going up.
Disclaimer on.
GG - 2013.10.28
Sabtu, 26 Oktober 2013
Forecast - 2013.10.26
XAU is clearly in an uptrend. The clear path is between the Red R/S trendline.
But there is another Resistance that we have to pay attention. Just see the green Resistance.
Gold has been rejected several times around that Resistance. And the last H4 candle also been rejected by the time I write this.
This H4 candle will be completely done in around 2 hours from now and will be the last H4 candle before the market close. This candle will be the key candle. If it forms a doji / inverted hammer / evening star, then I think there is a big possibility that gold will have a pullback downside a little bit.
Just take care and have a nice weekend.
GG - 2013.10.26
Langganan:
Postingan (Atom)